The graphs of motion for an object released from rest in free fall.
The following simulation shows the movement of a particle along a straight line, with its displacement varying with time. You can observe how the velocity (the gradient of the displacement-time graph) is calculated at each point using the "Show Calculation" toggle. You can also switch to "Quiz Mode" to test your understanding of describing motion from graphs.
Gradient Concepts |
Area Under the Graph Concepts |
|---|---|
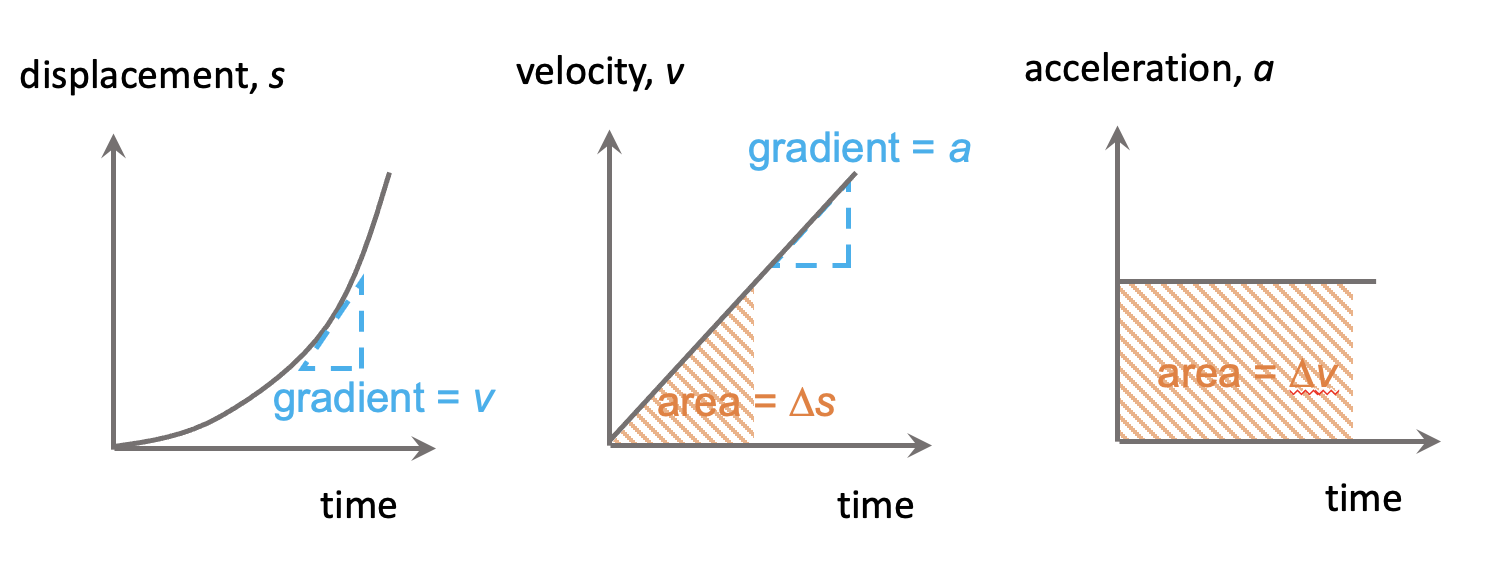
Velocity as gradient of displacement-time graphSince velocity is defined as the rate of change of displacement, its value can be obtained from the gradient of the tangent of a displacement-time graph. |
Displacement as area under velocity-time graphThe change in displacement can be obtained from the area under the velocity-time graph. The area referred to is that which is bounded by the line in the graph and the time axis, across the width of duration of change. If the area is found under the time-axis, the change in displacement is then given a negative sign and is associated with a decrease, as opposed to an increase, in displacement. |
Acceleration as gradient of velocity-time graphIn the same way, acceleration can be obtained from the gradient of the velocity-time graph. |
Velocity as area under acceleration-time graphIn the same way, change in velocity is obtained from the area under the acceleration-time graph. |
The simulation below shows the variation in the displacement, velocity and acceleration of an object being projected upwards from the ground. The object begins with a velocity in the upward direction (taken as positive) and experiences a constant downward acceleration throughout until it returns to the original height.
Observe how the graphs change. You can use the sliders to control the time as well as the initial velocity u.
Displacement-Time Graph: This graph shows how the ball's height above the ground changes with time. Initially, the displacement decreases at an increasing rate as the ball falls. After a bounce, it increases at a decreasing rate until it reaches a peak (where the velocity becomes zero), and then decreases at an increasing rate again as the ball falls back to the ground. This repeats itself with every bounce.
Velocity-Time Graph: Starting from rest, the velocity increases linearly in the negative direction due to the downward acceleration until it reaches the ground. Just after the bounce, velocity then points towards the upward direction (positive) and its magnitude decreases until it reaches the top. Thereafter, its magnitude increases in the downward direction (negative). This repeats itself with every bounce.
Acceleration-Time Graph: The acceleration remains constant at -g when the ball is in the air but becomes a very large positive value (due to a large upward net force) each time it comes into contact with the ground.